MLE for Poisson Distribution
MLE for Poisson Distribution
Poisson Example: In a study, researchers are interested in anayzing co-speech gestures (arm and hand movements accompanying the speech) by Katalan and Korean speakers. The data below comes from study in which participants watched a cartoon and then told a partner (a friend or a professor) about what they had seen. The data is available as a .csv file in the following Github repository.
If you place the word flat at the beginning of data url you can quickly view data as a Flat Data as given here.
Question: Assuming that the number of gestures follows a Poisson distribution with a mean parameter \(\lambda\). Find the maximum likelihood estimate of \(\lambda\) based on this sample.
#turn off warnings
import warnings
warnings.filterwarnings("ignore")
#import required libraries
import pandas as pd
import numpy as np
from scipy.special import factorial
import matplotlib.pyplot as plt
First import the data, check its shape (size), and hava a look at a few first lines. Please note that to read a .csv file from a GitHub repository, first go to the url where the data is available, click on the data set, then a preview window will open, and click on the Raw data button, copy thins url and paste it into pd.read_csv.
gesture_data = pd.read_csv("https://raw.githubusercontent.com/bodowinter/poisson_tutorial/main/dyads.csv")
#size of the data frame
gesture_data.shape
(54, 6)
#let's see the first 10 rows
gesture_data.head(n = 10)
| ID | context | dur | language | gender | gestures | |
|---|---|---|---|---|---|---|
| 0 | Catalan_1 | friend | 137 | Catalan | M | 61 |
| 1 | Catalan_1 | prof | 136 | Catalan | M | 78 |
| 2 | Catalan_2 | friend | 90 | Catalan | F | 31 |
| 3 | Catalan_2 | prof | 107 | Catalan | F | 40 |
| 4 | Catalan_3 | friend | 181 | Catalan | M | 81 |
| 5 | Catalan_3 | prof | 165 | Catalan | M | 49 |
| 6 | Catalan_4 | friend | 130 | Catalan | M | 32 |
| 7 | Catalan_4 | prof | 115 | Catalan | M | 49 |
| 8 | Catalan_5 | friend | 122 | Catalan | F | 39 |
| 9 | Catalan_5 | prof | 125 | Catalan | F | 32 |
Get the gestures column only and change its name.
#get only the gestures column
data = gesture_data.gestures
Check the mean.
np.mean(data)
49.44444444444444
#creater a grid vector for lambda
lambd = np.arange(1, 1000, 1)
#print(lambd)
Define a function which calculates the MLE of the data under a Poisson distribution. This function requires two parameters: data and a vector of possible values for \(\lambda\) parameter. Then, the function calculates the log-likelihood of the data for each \(\lambda\) value, and plot log-likelihood values versus \(\lambda\) values. The \(\hat \lambda\) where the curve the attains a maximum can considered as the maximum likelihood estimate for \(\lambda\).
def poisson_loglik_plot(data, lambd):

    #fixed values
    n = np.size(data)
    sum_x = np.sum(data)
    sum_in_x_factorial = np.sum(np.log(factorial(data)))

    #define log_likelihood
    log_lik = -lambd*n + sum_x * np.log(lambd)-sum_in_x_factorial

    # plot log-lik versus lambda values
    fig, ax = plt.subplots(figsize = (6, 6))

    plt.plot(lambd, log_lik)
    plt.axvline(x=lambd[np.argmax(log_lik)], color='r') #find the lambda where log-lik is a maximum.
    ax.text(49, -48000, '49', color='red', ha='center', va='top') #not a smart way
    plt.xlabel(r'$\lambda$')
    plt.ylabel('Log-likelihood value')
    plt.title('Log-likelihood of gestures data under Poisson Distribution')
    plt.legend(loc='upper right')
    plt.show()
poisson_loglik_plot(data = data, lambd = lambd)
No artists with labels found to put in legend. Note that artists whose label start with an underscore are ignored when legend() is called with no argument.
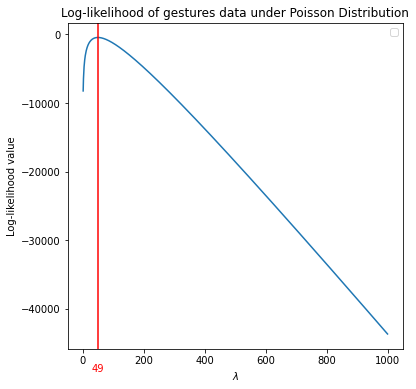
The \(\hat \lambda\) = 49 is the MLE for \(\lambda\).
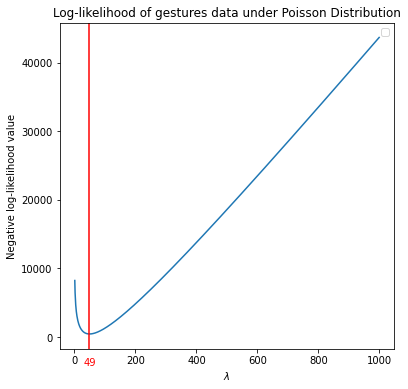
Some optimzation routines in Python may prefer minimizing an objective function. In that case, we need to define negative log-likelihood. In such a case, the \(\hat \lambda\) where the curve the attains a minimum can considered as the maximum likelihood estimate for \(\lambda\).
def poisson_negloglik_plot(data, lambd):

    #fixed values
    n = np.size(data)
    sum_x = np.sum(data)
    sum_in_x_factorial = np.sum(np.log(factorial(data)))

    #define log_likelihood
    log_lik = -lambd*n + sum_x * np.log(lambd)-sum_in_x_factorial

    neg_log_lik = -log_lik

    # plot neg-log-lik versus lambda values
    fig, ax = plt.subplots(figsize = (6, 6))

    plt.plot(lambd, neg_log_lik)
    plt.axvline(x=lambd[np.argmin(neg_log_lik)], color='r') #find the lambda where neg_log-lik is a minimum.
    ax.text(49, -3000, '49', color='red', ha='center', va='top') #not a smart way
    plt.xlabel(r'$\lambda$')
    plt.ylabel('Negative log-likelihood value')
    plt.title('Log-likelihood of gestures data under Poisson Distribution')
    plt.legend(loc='upper right')
    plt.show()
poisson_negloglik_plot(data = data, lambd = lambd)
No artists with labels found to put in legend. Note that artists whose label start with an underscore are ignored when legend() is called with no argument.
We can also find the maximum (minimum) point where the log-likelihood (negative log-likelihood) attains through an optimization routine.
First define neg-log-lik as a function.
def poisson_negloglik(lambd):

    #data is not an input argument, assuming data object is already available in the session.
    #fixed values
    n = np.size(data)
    sum_x = np.sum(data)
    sum_in_x_factorial = np.sum(np.log(factorial(data)))

    #define log_likelihood
    log_lik = -lambd*n + sum_x * np.log(lambd)-sum_in_x_factorial

    neg_log_lik = -log_lik

    return neg_log_lik
Then use minimize() function fom Scipy.optimize with method='L-BFGS-B' to find the arg min.
from scipy.optimize import minimize
poisson_mle = minimize(poisson_negloglik, np.array([1]), method='L-BFGS-B')
poisson_mle
      fun: 443.5523349036321
 hess_inv: <1x1 LbfgsInvHessProduct with dtype=float64>
      jac: array([0.])
  message: 'CONVERGENCE: NORM_OF_PROJECTED_GRADIENT_<=_PGTOL'
     nfev: 34
      nit: 14
     njev: 17
   status: 0
  success: True
        x: array([49.4445145])