# Multiple curves in one plot
import numpy as np
import matplotlib.pyplot as plt
import scipy.stats as stats
#------------------------------------------------------------
# control the parameter settings
# takes std as input argument, not variance
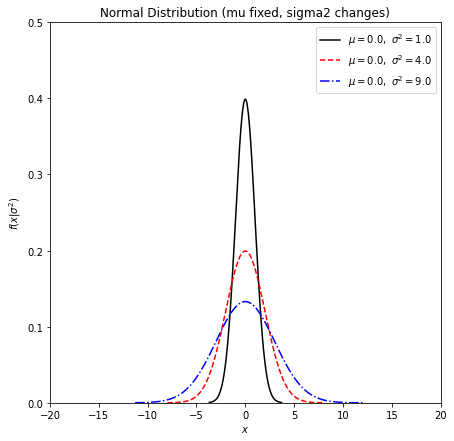
sigma_values = [1, 2, 3]
linestyles = ['-', '--', '-.']
colors = ['black', 'red', 'blue']
#------------------------------------------------------------
# plot the distributions
fig, ax = plt.subplots(figsize=(7, 7))
for s, ls, cl in zip(sigma_values, linestyles, colors):
x = stats.norm.rvs(loc = 0, scale = s, size = 10000)
x1 = np.sort(x)
plt.plot(x1, stats.norm.pdf(x1, loc = 0, scale = s), ls=ls, c=cl,
label=r'$\mu=%.1f,\ \sigma^2=%.1f$' % (0,s*s))
plt.xlim(-20, 20)
plt.ylim(0, 0.5)
plt.xlabel('$x$')
plt.ylabel(r'$f(x|\sigma^2)$')
plt.title('Normal Distribution (mu fixed, sigma2 changes)')
plt.legend(loc=0)
plt.show()